
Documentation
To find the complete documentation of the project click the button
User Guide
The tool Config Replicator has two scripts that can be used, the first one is text based and the second one has a nice GUI developed with the QT library. both scripts run with Python 3. This tools were designed to replicate the same configuration to a lot of network devices, and it does it by leveraging the threading library in order to span different threads to reach devices "simultaneously" this is not completely true because the python GIL but it helps to speeds up the process.
The high level steps to use the tool can be summarized as follows:
- Select the script to send to each device
- Select the destination list where to send the script selected
- Select the number of threads to use
- Enter the Username and Password to use to connect to the devices
- Enter the enable password if enable was configured in ‘config.cfg’
The text based script is pretty self explanatory so we are going to focus on the GUI, just remember that the process is exactly the same for both versions.
Config Replicator GUI
You have to start the script by going into the directory where it is installed and type:
python3 config_replicator_gui.py
The first dialog present a summary of the software and some useful information, if this is your first time using the tool, please read it.

After you click ok, you will be presented with the main window
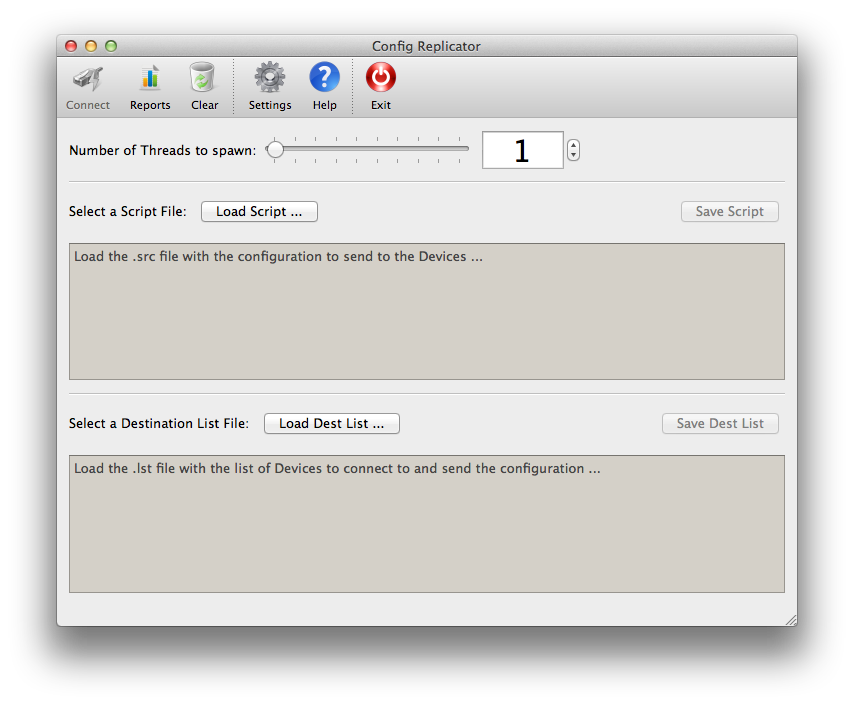 In the main window you will see a toolbar and three main areas, the first area is at the top and you could choose the number of threads to use to speed up the process, the number of threads is limited to 100 but you should do a check first in order to avoid undesirable results. The next area is where you could choose the script to use, you could edit the script with the gui and save it on the same file or in a new one with the button “Save Script”, in the last area you could choose the destination list and as in the scripts you could edit it and save it on the same file or in a new one with the button “Save Dest List”
On the toolbar you could see a number of icons that are described below:
- Connect: Used to connect to the devices using the script, list and number of threads selected, this button wont be activated unless you choose the script and destination list.
- Reports: Here you could see the reports generated after a run, that means that you should select the script, the destination list and press connect, when you return to this window you could launch the reports.
- Clear: With this button you clear everything to begin again.
- Settings: With this button you could edit the config.ini file.
- Help: The help button
- Exit: To exit the program
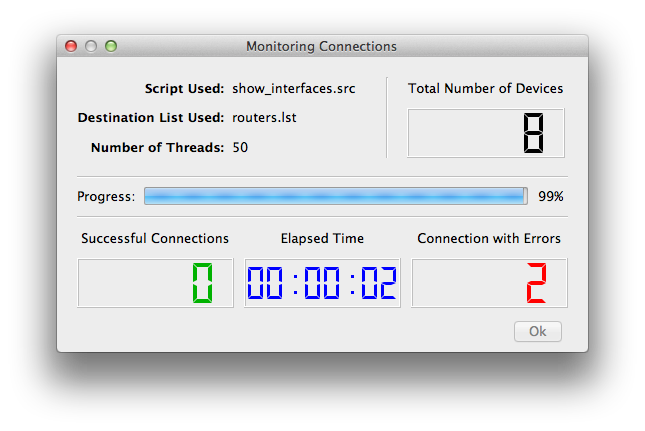
When you press connect you will be prompted for the username and password and enable password if enabled on the config file (the credentials are not saved anywhere)
Then the monitoring window appears where you can monitor the progress of the run.
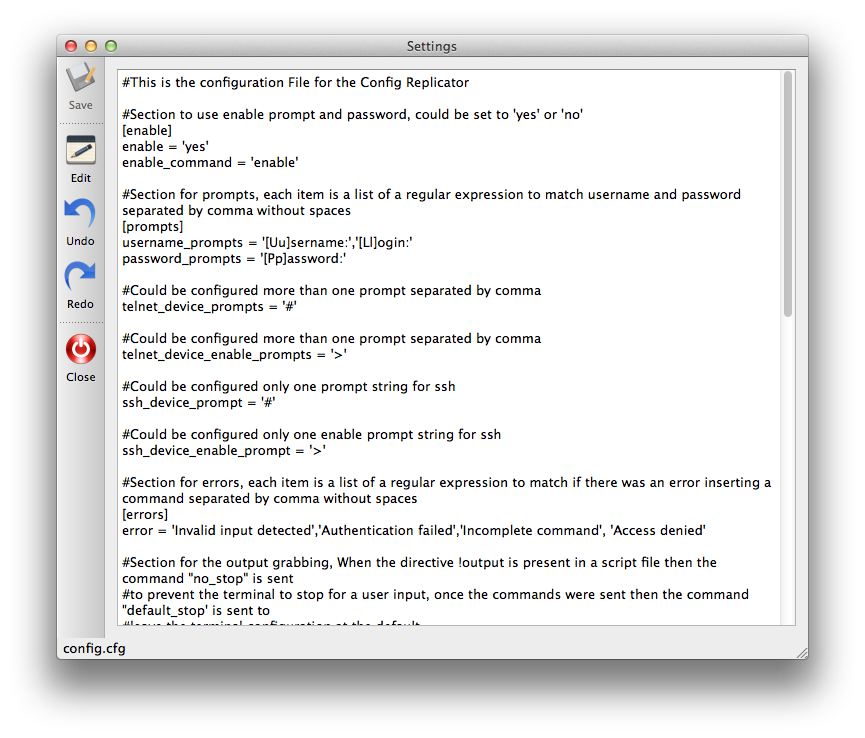
The Settings Window
You can reach this window by pressing the settings button on the toolbar of the main window, here you can change the config.ini file
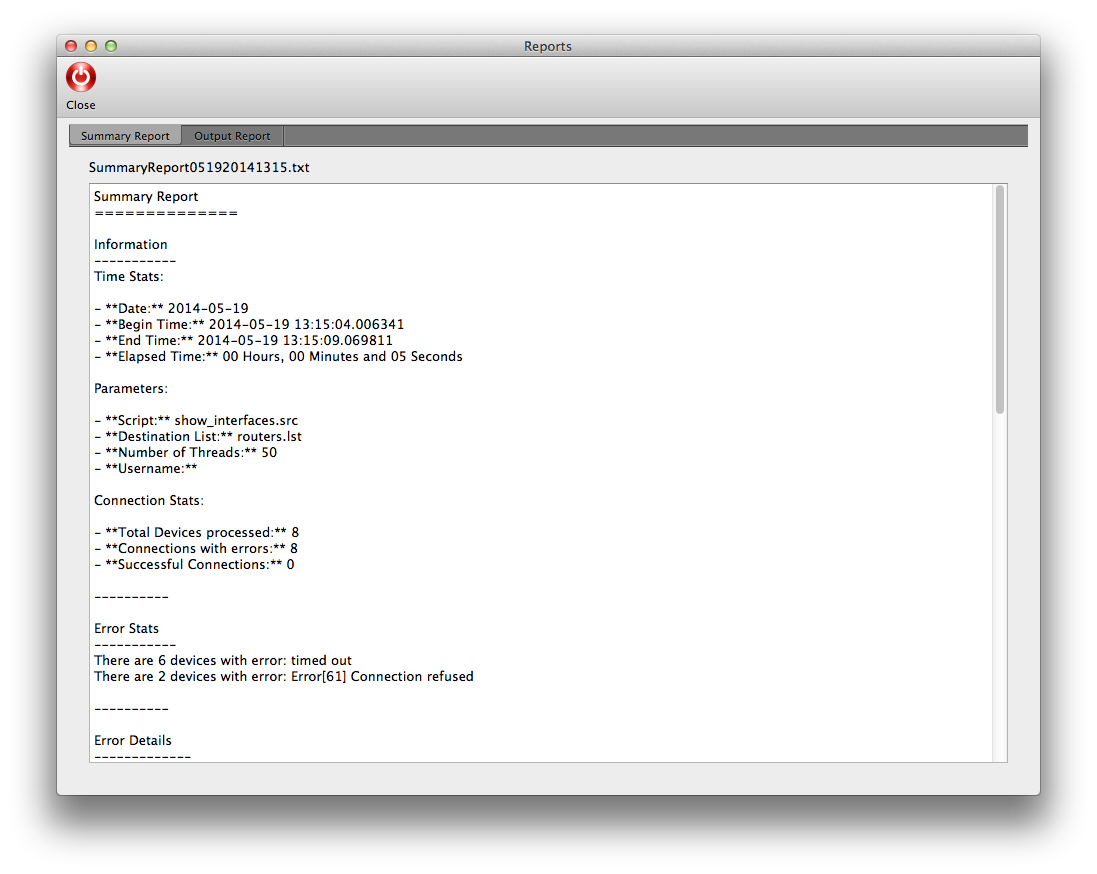
The Report Window
Once the run is done and you close the monitoring window you could press reports in the main window to see the generated reports (Summary and Output if the script specified it)
Script Files
All the scripts files should be saved with an .src extension on the scripts directory.
The script files should have a .src extension and it is a plain device script with the same command used if you were in front of a vty console connected to it, for example if you are connecting to a Cisco Router then it should be commands as the ones you will send when you are connected via telnet/ssh to the router.
There are other directives that could be configured on the scripts that tells the program some things, this directives are:
- !desc: This directive is used to add a Description comment in the Scripts Menu (text based script)
- !output: This directive without the quotes are used to specify that the output of the commands should be grabbed.
When the directive !output is used, the output will be saved on a file called OutputReportMMDDYYYY.txt inside the directory reports
You should be sure that there is always a blank line at the end of the script to ensure that the last command is sent without any problem, if the script is for Cisco devices it is recommended to finish all the script with the character ”!” without the quotes
You can see the script examples in the directory scripts.
List Files
All the destination lists should be saved with a .lst extension on the lists directory. The format of this file is:
<Ip_address> <Name_of_the device> <[telnet/ssh]>
And all the fields are mandatory, it is important to mention that the software will connect to the device with the ip address and not the hostname, the hostname is just for reporting purposes.
For example:
10.10.10.1 Denver_Router telnet –> it will connect to the Denver_Router with an ip address of 10.10.10.1 via telnet.
10.10.10.1 Denver_Router –> it is the same as the previous entry, the default method of connection is telnet, if no method of connection is found or the name is not recognizable then telnet will always be used.
10.10.10.1 Denver_Router ssh –> it will connect to the Denver_Router with an ip address of 10.10.10.1 via ssh.
As in the scripts files the destination list files use also the !desc: directive to show the description of the list in the List Menu (text based script)
You can see list examples in the directory list.
Report Files
Config Replicator generate two types of output reports, the first one it is always generated after each run of the program and are called Summary Reports, the second one is only generated when the script file has the directive !output configured. The name format of the files are:
SummaryReportMMDDYYYYHHMM.txt and OutputReportMMDDYYYYHHMM.txt where:
- MM: Month when the report was generated
- DD: Day when the report was generated
- YYYY: Year when the report was generated
- HH: Hour when the report was generated
- MM: Minute when the report was generated
More Information
To find more detailed information of this tool you can go to the github page of the tool by clicking on the button at the top of the page